The hypothetical-deductive method is the logical process still commonly used in scientific research. After observing an event, researchers formulate one or more hypotheses that may explain its cause, then test these hypotheses based on data collected during an experiment. This process involves testing a null hypothesis (Hp0), which contrasts with the initial alternative hypothesis (HpA—sometimes referred to as Hp1). To accurately reject or accept the null hypothesis, it is necessary to include a sufficient number of statistical units.
This article analyzes in detail the relationship between sample size and statistical inference, emphasizing the implications related to test power.
Type I and Type II Statistical Errors
In accordance with the principle of falsifiability, the experimenter rejects the null hypothesis in the case of significance (indicated by α), defined through a specific probabilistic measure known as the p-value. The significance level α is predetermined by the experimenter and is generally set at 5%, with the corresponding p-value equal to 0.05. This means the experimenter accepts a 5% probability of incorrectly rejecting the null hypothesis when it is actually true. Statistically, this error is defined as Type I error, which contrasts with Type II error (defined as β), occurring when a false null hypothesis is accepted.
Hp0 true | Hp0 false | |
|---|---|---|
Hp0 refused | Error type I | CORRECT |
Hp0 accepted | CORRECT | Error type II |

Statistical errors can significantly impact experimental results and lead to misleading conclusions. For example, if an experimenter wishes to test the safety of two products, a Type I error (with Hp0: there is no difference between the two products) could result in the conclusion that the treatments differ, when in fact no such effect exists (false positive). Conversely, a Type II error related to the same hypothesis could lead to the conclusion that the two products have similar safety profiles when they actually differ (false negative).
Power of a Statistical Test
Type II error indirectly measures the power of the statistical test, which is the probability of detecting an effect when it is actually present. The higher the power of the test, the lower the likelihood of committing a Type II error.
In fact, Type I error, Type II error, and statistical power are three closely connected aspects. For instance, consider an experimental condition in which the effect of a medical device (MD) is tested against a placebo (P) based on a variable (e.g., persistence in minutes on the skin). The experiment can be structured to test the following null hypothesis:
- Hp0: Patients treated with the MD do NOT show a significantly different product persistence compared to patients treated with P;
This contrasts with the respective alternative hypothesis:
- HpA: Patients treated with the MD show a significantly different product persistence compared to patients treated with P.
The significance level α is arbitrarily set at 5% (p=0.05), and measurements are taken from 20 patients for each experimental condition.

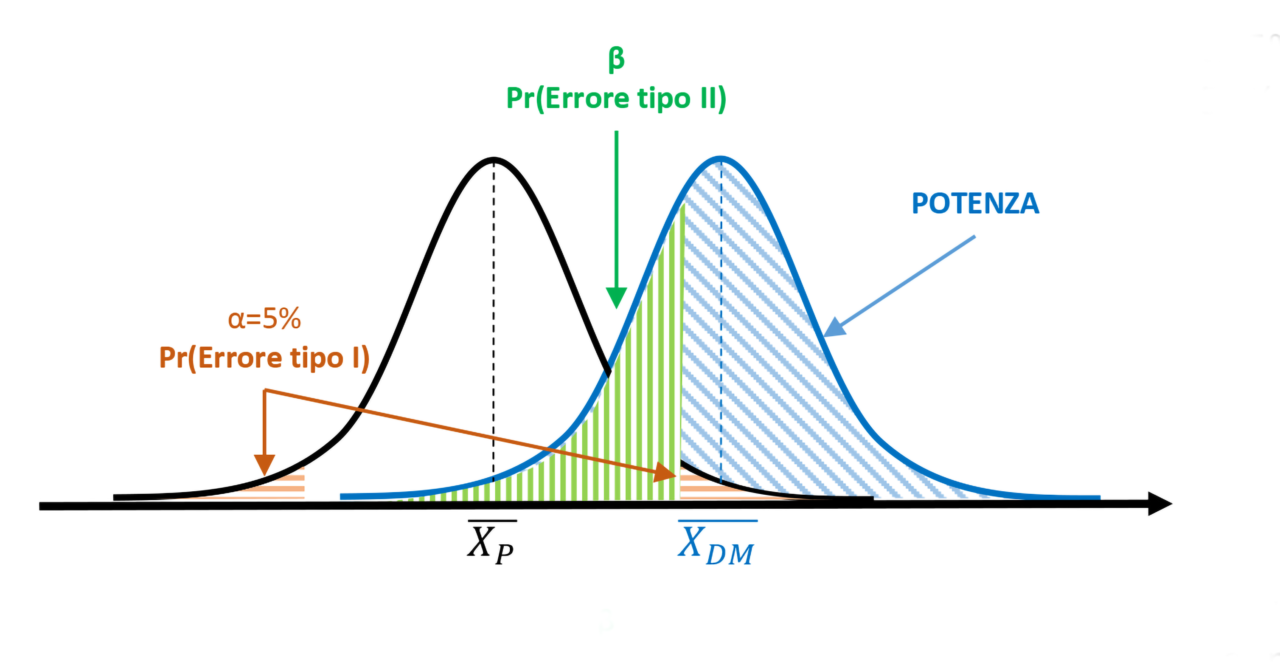
Figure 1. α=5% and test power > 50%
The collected data lead to calculating a statistical value exceeding the critical value that delineates the 5% rejection area (orange area). The null hypothesis is thus rejected, inferring that the measurements taken after treatment with the medical device belong to a different population compared to those obtained from subjects treated with placebo. Based on the significance threshold α, there remains a 5% probability of committing a Type I statistical error. However, considering the degree of overlap between the two populations, it is also possible to determine the value of β (green area), which defines the probability of committing a Type II error. The blue area to the right of the β limit represents the power of the test (1-β). In this case, the power covers more than half of the area of the MD population curve, exceeding 50%.
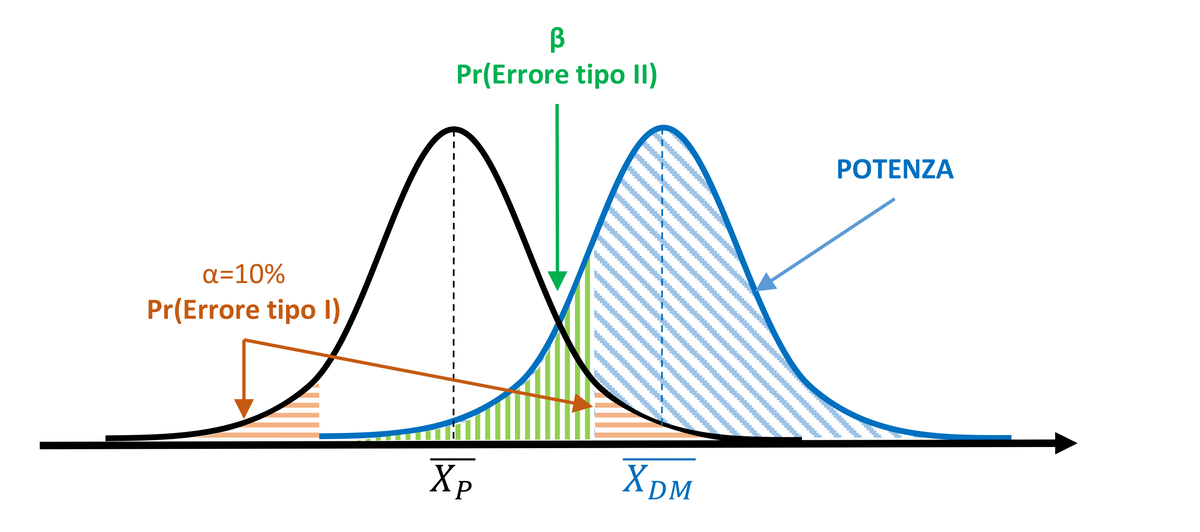
To increase the power of the test and reduce the probability of committing a Type II error, the experimenter might decide to widen the significance region α, setting it to 10%. However, this also increases the probability of committing a Type I error (10%).
I dati raccolti portano a calcolare un valore statistico superiore al valore critico che delimita l’area di rifiuto pari al 5% (area arancione). L’ipotesi nulla viene quindi rigettata, inferendo che le misure effettuate dopo trattamento con il dispositivo medico appartengono a una popolazione diversa rispetto alle misure ottenute dai soggetti trattati con placebo. In base alla soglia di significatività α, resta una probabilità del 5% di commettere un errore statistico di tipo I. Considerando il grado di sovrapposizione delle due popolazioni, però, è possibile determinare anche il valore di β (area verde), che definisce la probabilità di commettere un errore di tipo II. L’area blu alla destra del limite di β rappresenta la potenza del test (1-β). In questo caso, la potenza copre più della metà dell’area della curva della popolazione DM, risultando superiore al 50%.
Per aumentare la potenza del test e ridurre la probabilità di commettere un errore di tipo II, lo sperimentatore può decidere di allargare la regione di significatività α, ponendola pari a 10%. Tuttavia, così facendo, aumenta la probabilità di commettere un errore di tipo I (10%).

Figure 2. Power increases with α=10%, but the probability of Type I error increases.
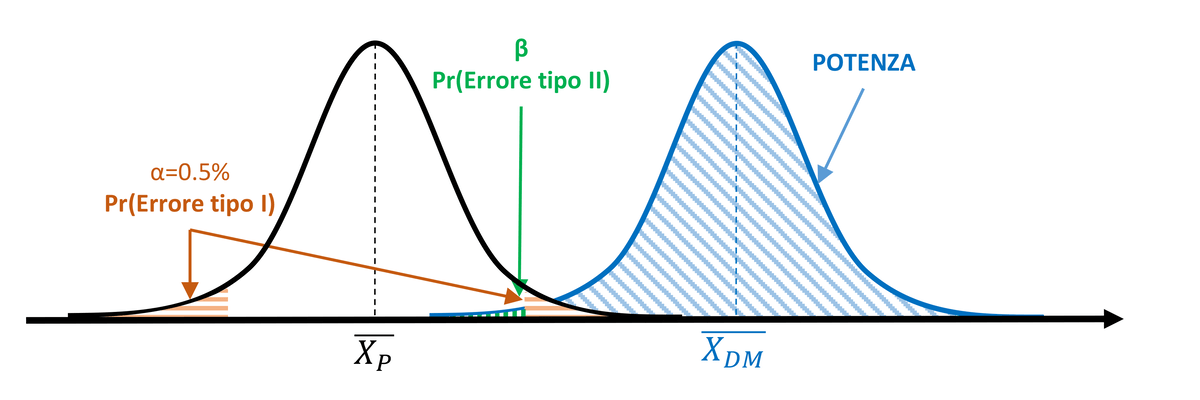
Intuitively, with the same α, the power of the test will increase as the effect of the medical device increases and as the curve width (i.e., the standard deviation) changes. Therefore, with the same standard deviation, the power of the test will be greater the more the mean of the MD population diverges from the mean of the P population.

Figure 3.With equal α (5%) and standard deviation σ, power increases as the difference between means increases (the treatment effect is more pronounced).
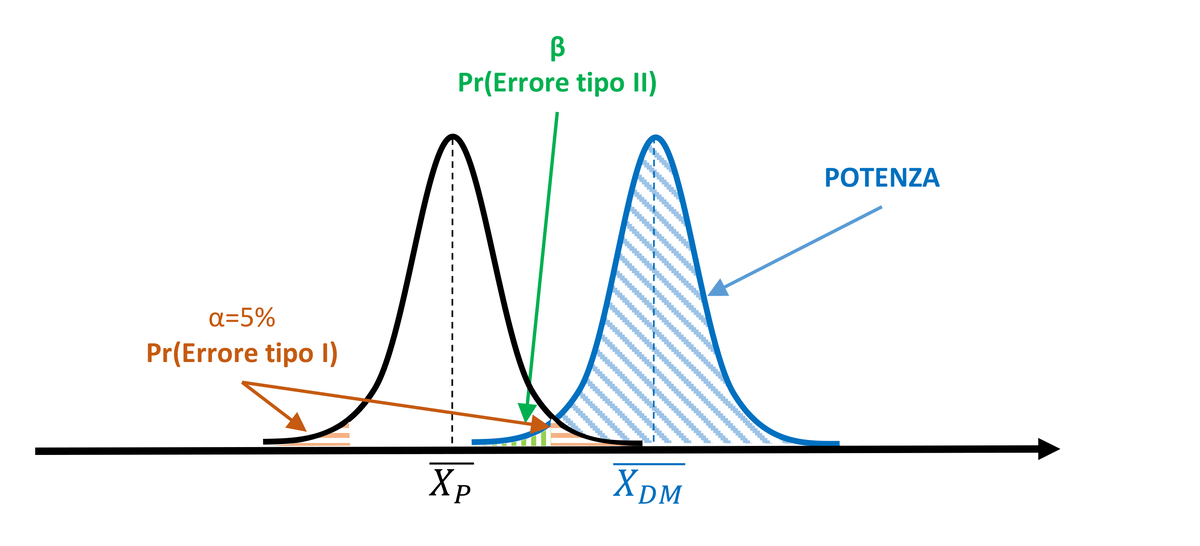
Similarly, with the same distance between the means, power will increase depending on the curve width and its standard deviation. In fact, reduced dispersion of values around the mean will also decrease the degree of overlap of the curves, resulting in an increase in the power of the statistical test.

Figura 4. With equal α (5%) and mean difference, power increases as the standard deviation σ decreases.
Power Analysis
Depending on the statistical test, the probability of committing a Type I or Type II error, and the magnitude of the treatment effect under investigation, it will be necessary to include a different number of experimental units to reach reasonably reliable conclusions. It is important to note that a higher number of statistical units also entails greater experimental effort, significantly impacting the timing and costs of the experiment, especially in clinical settings.
Is there a way to determine a priori the sample size?
The answer is yes, and it lies in power analysis.
Power analysis is an analytical technique based on four closely interconnected parameters:
- Effect size (d)
- Sample size (n)
- Significance level (α)
- Statistical power (1-β)
Power analysis allows for estimating one of these four parameters when the experimenter knows the other three. In most cases, this technique is applied a priori (before starting the experimental phase) to calculate the minimum sample size (n) needed to observe the effect of interest. While the significance level α is generally set arbitrarily at 5% (0.05) and statistical power at 80% (0.8, with β=0.2=20%), the effect size is calculated based on literature data or reasonably proposed estimates by the experimenter. This parameter is calculated as the ratio of the difference between the means (resuming the previous example Xdm – Xp), divided by a general estimate of standard deviations, summarizing in a single number (d) the degree of overlap between two experimental populations. Based on these considerations, it can be easily inferred that the number of experimental units required to ensure a power of 80% or higher decreases as the effect size d increases. In other words, if a treatment is extremely effective, only a few measurements will be needed to detect that the measures belong to two distinct populations, thus determining statistical significance. Conversely, a larger sample size will allow for the detection of even a less pronounced experimental effect. It remains the experimenter’s responsibility to interpret the clinical relevance of the result.
Conclusion
A poorly structured and robust experimental approach can lead the experimenter to erroneous and misleading conclusions. Sample size significantly impacts the accuracy of statistical inference but must be carefully evaluated concerning the experimental conditions of interest. Power analysis can be an extremely useful tool for defining a priori the number of experimental units necessary to ensure adequate statistical power.
La power analysis
A seconda del test statistico, in funzione della probabilità di commettere un errore di tipo I o di tipo II e in relazione alla magnitudo dell’effetto del trattamento indagato, sarà necessario includere un numero diverso di unità sperimentali per poter pervenire a conclusioni ragionevolmente affidabili. In questa fase non si può tralasciare che un numero più elevato di unità statistiche comporta anche uno sforzo sperimentale maggiore, incidendo in modo sostanziale sulle tempistiche e sui costi dell’esperimento, soprattutto in ambito clinico.
Esiste un modo per determinare a priori la numerosità campionaria? La risposta è sì e risiede nella power analysis.
La power analysis è una tecnica analitica basata su quattro parametri strettamente interconnessi:
- Dimensione dell’effetto sperimentale (d)
- Dimensione campionaria (n)
- Significatività (α)
- Potenza statistica (1-β)
La power analysis permette di stimare uno di questi quattro parametri nel momento in cui lo sperimentatore è a conoscenza degli altri tre. Nella maggior parte dei casi, questa tecnica viene applicata a priori (prima di iniziare la fase sperimentale) per calcolare la dimensione campionaria minima (n) per osservare l’effetto di interesse. Mentre la significatività α viene generalmente posta arbitrariamente pari al 5% (0.05) e la potenza statistica pari a 80% (0.8, con β=0.2=20%), la dimensione dell’effetto sperimentale viene calcolata sulla base di dati di letteratura o su stime ragionevolmente proposte dallo sperimentatore. Questo parametro viene calcolato come il rapporto tra la differenza tra le medie (riprendendo l’esempio proposto in precedenza Xdm – Xp), diviso una stima generale delle deviazioni standard, riassumendo in un unico numero (d) il grado di sovrapposizione tra due popolazioni sperimentali. Sulla base di queste considerazioni, si può facilmente intuire che il numero di unità sperimentali necessarie a garantire una potenza pari o superiore a 80% diminuisce all’aumentare della dimensione dell’effetto sperimentale d. In altre parole, se un trattamento è estremamente efficace, basteranno poche misurazioni per rilevare che le misure appartengono a due popolazioni distinte e determinare quindi una significatività statistica. Al contrario, una maggiore dimensione campionaria permetterà di rilevare anche un effetto sperimentale meno marcato. Sarà comunque cura dello sperimentatore interpretare la rilevanza del risultato da un punto di vista clinico.
Conclusione
Un approccio sperimentale poco robusto e strutturato può portare lo sperimentatore a pervenire a conclusioni errate e fuorvianti. La dimensione campionaria incide in modo rilevante sull’accuratezza dell’inferenza statistica, ma deve essere valutata con oculatezza in relazione alle condizioni sperimentali di interesse. La power analysis può essere uno strumento di estrema utilità per definire aprioristicamente il numero di unità sperimentali necessarie a garantire una adeguata potenza statistica.


